
Since hitting lows in April, the S&P 500 has bounced back and is now on track to turn in a solid year.
The market has been buzzing. After nearly tipping into bear territory in April, the S&P 500 index has stormed all the way back to hit all-time highs and is now up about 8% on the year as of July 23.
While volatility has calmed down a bit since President Donald Trump first announced high tariff rates back in April, nothing has been able to slow the market down, despite renewed focus on tariffs, some data indicating the economy is slowing, and increasing concerns about the U.S. government’s fiscal situation. In fact, the market just did some for only the fifth time in 50 years, and history says that a monumental move could follow.
Can the bull market keep going?
As reported by MarketWatch, Ryan Detrick, the chief market strategist at the Carson Group, recently crunched some data and found an interesting stat about the recent performance of the broader benchmark S&P 500.
Image source: Getty Images.
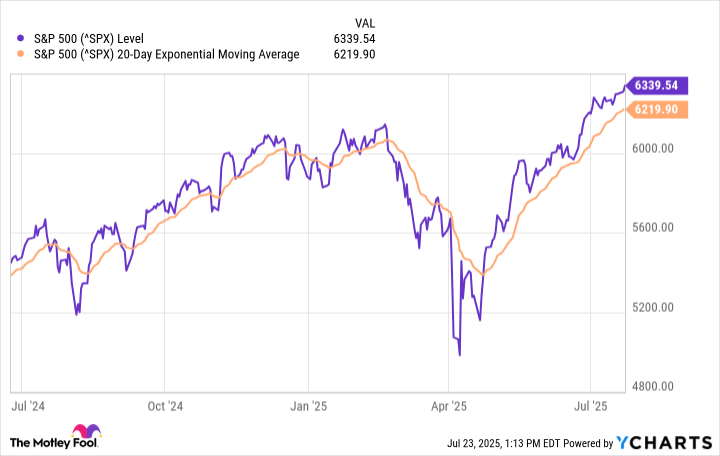
On July 21, the S&P 500 closed above its 20-day moving average for 60 straight days. Investors use moving averages to chart levels that could indicate some kind of breakout, meaning stocks heading higher. It’s used more by technical strategists, but can be useful for all investors when it comes to identifying trends or sentiment.
The S&P 500 has only achieved this feat four other times dating back to 1975, according to Detrick.
The good news for investors following this analysis is that when the market has finished above its 20-day moving average for 60 consecutive days in the past, good things have tended to happen, with the average return between 20% and 26% over the next year. Looking out one month, three months, six months, and a year from this event, there are only a few instances in which the market turned red.
“It is what it is, yet another clue this bull market has legs,” Detrick wrote in a research note. As of this writing on July 23, the S&P 500 looks to be about 1.9% above its 20-day moving average.
History rhymes but rarely repeats
When it comes to looking at broader market trends, historical data is a great resource. However, history rarely repeats itself exactly, even if different situations often have parallels. That’s why market downturns and recessions usually are unexpected, even when people are constantly worrying and watching.
Given the amount of volatility the S&P 500 has experienced this year, it’s quite possible the roller-coaster ride continues, and then the market still ends much higher one year from now. After all, the market is still dealing with high uncertainty about tariffs, potential concerns about inflation reigniting, and a potential slowdown of the labor market and economy.
So I think investors would be right to remain somewhat cautious and remember that market structure has changed a lot over the past several decades. That said, none of these concerns are exactly new, economic data has largely held up well, and it’s possible that Trump’s recent “one, big beautiful bill,” which includes trillions in tax cuts, continues to propel economic growth, at least in the near term.
Ultimately, investors are best off trying to take a long-term view, and not buying into individual stocks trading at meteoric valuations or those detached from fundamentals. The longer one holds their investments, the smaller the chance they have of losing money, and most long-term investors tend to do quite well.
Bram Berkowitz has no position in any of the stocks mentioned. The Motley Fool has no position in any of the stocks mentioned. The Motley Fool has a disclosure policy.